Configuring Line Charts
This section allows you to set up the line chart.
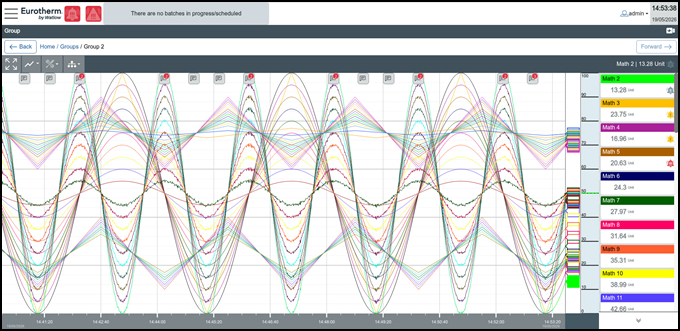
Line chart displays live values for each group channel in the related group in the form of a line.
-
Line Style - You can change the colour, pattern, thickness and opacity of each channel line
-
Title - Enables adding a title to the chart, providing context or description for the data being displayed
-
Grid Major & Minor - Allows customization of the major and minor grid lines, which provide visual reference points within the chart. Major grid lines are used for primary divisions, while minor grid lines offer finer-scale breakdowns of the data.
-
Grid Scale Type - Specifies the type of scaling for the axes, such as linear or logarithmic scales. This ensures that the chart accurately reflects the nature of the data, especially when dealing with large or small variations in value.
-
Picture of the Trends - Displays a visual representation of the overall trends
-
Select Channel - Provides functionality for selecting specific channels. This feature should help the user to focus on the good channel. When a channel is selected, we should see it descriptor, unit, and value
-
Channel Cycling Selection - If activated, the channel selection will be switched on at a specific interval.
-
Channel Order - Allows control over the display order of the channels.
-
Orientation - Charts should be available in each direction, in each device size.