Configuring Bar Charts
This section allows you to set up the bar chart:
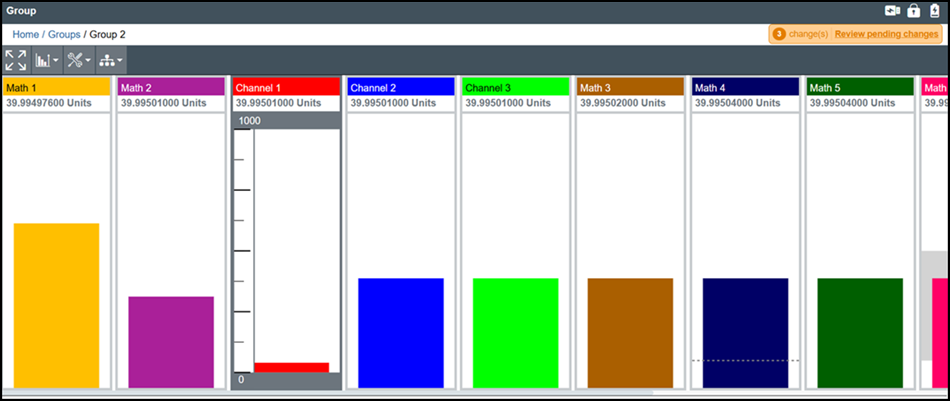
A bar chart displays only the last available value.
-
Axis Display for Each Bar - This feature enables or disables the display of an axis next to each individual bar
-
Grid with Major and Minor Ticks - Allows for the inclusion of a grid with both major and minor ticks, providing finer control over the visual reference points within the chart
-
Scale Type for Each Channel - Enables the ability to set different scale types for each data channel
-
2D or 3D Bars - Supports rendering the bars in either 2D or 3D. The 3D mode adds depth to the visualization
-
Bars in Multiple Directions - Allows the bars to be displayed in multiple directions (e.g., vertical or horizontal)
-
Display Information on Bars (Unit, Value, or Descriptor) - Allows additional information, such as units, values, or descriptors, to be displayed directly on the bars
You can configure Bar Chart options for a Group. For more information, refer to the section Bar View on Configuring Groups Settings.