Configuring Groups Settings
To configure a Group:
-
From the EPM User Interface screen, select Options
 - Groups: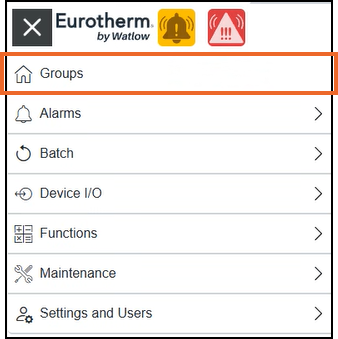
-
From the Groups screen, identify the required group card and select Options
 - Settings: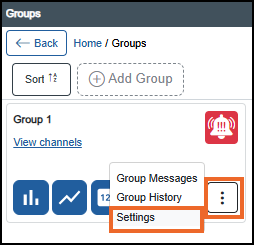
-
The Group Settings screen displays on the right-hand side, update as required:
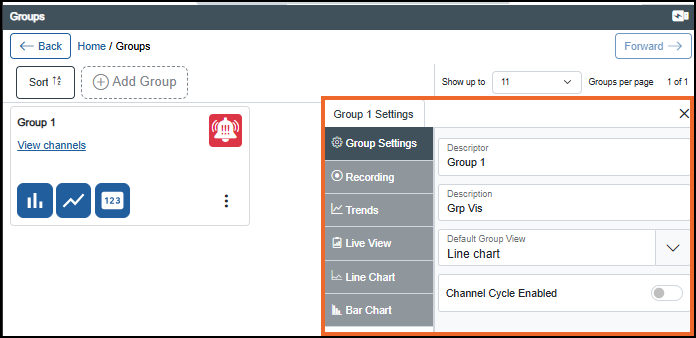
Select from the following options to expand the details:
 Group settings
-
Descriptor - Enter a meaningful name for this group, unique to each device. Group names are not permitted to have leading or trailing spaces.
Note - This is not case sensitive, for example, 'AbC' is regarded as identical to 'abc'. - Description - Enter a description for this group, for example, context about the purpose and contents of the group.
- Default Group View - Select a default view for the group from the available list:
- Bar chart - Compares discrete data points or visualizing categories in real-time.
- Line chart - Displays changes or trends over time in a continuous manner.
Channel Cycle Enabled (Only available for Bar chart and Line Chart views) - When On
 , the chart view automatically cycles through each channel in the group at the specified cycle time.
Numeric chart - Displays numerical data highlighting specific values or relationships.
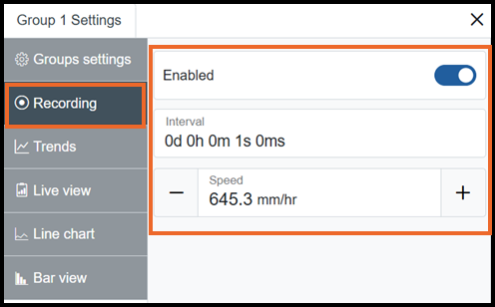
Recording
-
Enabled - Records data based on your settings. By default, recording is enabled for all newly created groups. When you disable the recording, Recording Disabled
 appears on the relevant Group card.Tip - When recording is disabled, new data is not recorded, but historical data is preserved.
 -
Interval - Interval time between each recorded data point.
Tip - A shorter interval records more frequent changes. Maximum rate 1 hour, Minimum rate 100 ms.Enter number of days in d, hours in h, minutes in m, seconds in s and milliseconds in ms or use the Up
 and Down
  arrows to set the value. Select Apply
  , or Cancel to exit
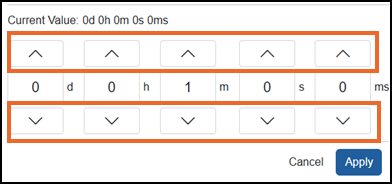 Tip - A single select moves the numbers one at a time, a long hold moves through the numbers quickly.
NOTICE
RISK OF DATA LOSS OR CORRUPTION
You must set your Recording Interval and Trend Interval to the same value.
Failure to follow this instruction can result in data loss
Note - When the Recording Interval and Trend Interval are same it ensures alignment of the display values and historic data.Trends
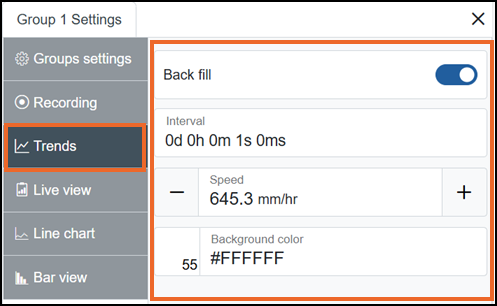
-
Interval - Select to set the interval at which the trend data saves. This value affects how much trace history appears per screen in trend history mode (Historic). For example, if set to 1000 ms (one second), the system will record at intervals of every one second.
-
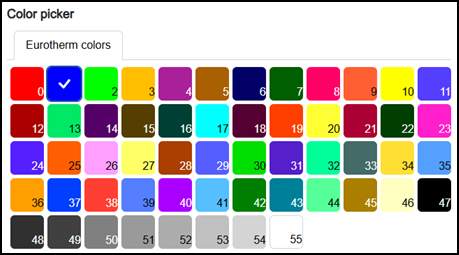
Background Color - Select a color from one of the 56 available colors and set the background color of the chart (default color, #FFFFFF 'White'):
Notice
RISK OF DATA LOSS OR CORRUPTION
You must set your Recording Interval and Trend Interval to the same value.
Failure to follow this instruction can result in data loss
Note - When the Recording Interval and Trend Interval are same it ensures alignment of the display values and historic data.Live View
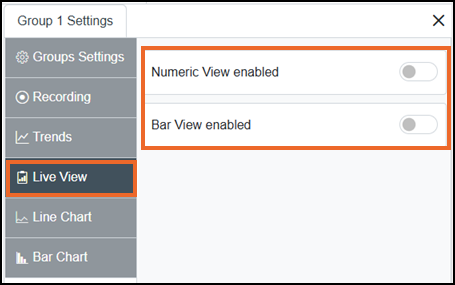
Select a view to display the Live View:
-
Line Chart Enabled - Change to On
to display the Live View as a line chart. - Numeric View Enabled - Change to On to display the Live View as a numeric chart.
- Bar View Enabled - Change to On to display the Live View as a bar chart.See Using the Live View for details.
Note - The Group card displays only the views enabled here. For example, if Numeric View and Bar View are disabled, the Group card shows only the Line Chart view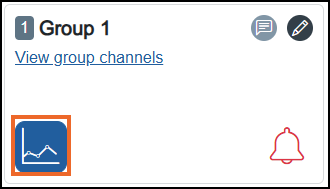 .Line Chart
Line Chart displays changes or trends over time in a continuous manner:
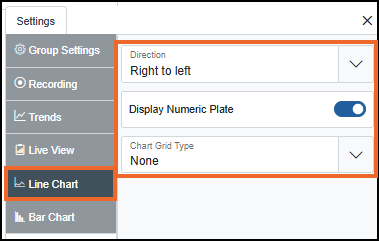
- Direction - Select an orientation for displaying data from the available list:
- Top to bottom - Displays data from the top, moving downward. Useful for visualizing downward trends.
- Left To right - Displays data from the left, moving right. Common for time-series data with time on the x-axis.
- Right To left - Displays data from the right, moving left. Useful for reversing data or emphasizing past data.
- Display Numeric Plate - When On , displays numeric plates (labels) at specific points to highlight values on the line chart.
- Chart Grid Type - Select a grid type from the available list:
- None - Grid lines not displayed on the chart.
- Linear - Grid lines are spaced evenly based on a linear scale:
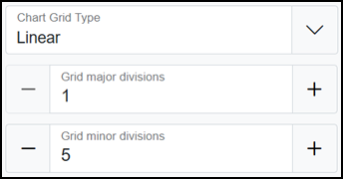
- Major Subdivision (only available if Linear is selected) - Defaults to 5, enter a number between 1 and 10, or use the Plus
 and Minus
  to set the value. Used to compare or track data over time.
 - Minor Subdivision (only available if Linear is selected) - Defaults to 5, enter a number between 1 and 10 to show detailed data points within a major division, or use the Plus and Minus to set the value. Allows granular analysis of trends within the broader categories and often represents time periods or specific regions, products, or demographic groups.
- Major Subdivision (only available if Linear is selected) - Defaults to 5, enter a number between 1 and 10, or use the Plus
- Logarithmic - Grid lines are spaced based on a logarithmic scale:
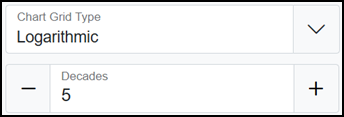
- Decades (only available if Logarithmic is selected) - Defaults to 5, enter a number between 1 and 20, or use the Plus or Minus to set the value.
- Decades (only available if Logarithmic is selected) - Defaults to 5, enter a number between 1 and 20, or use the Plus
- From Channel - Automatically applies the grid type based on the data source or channel settings:
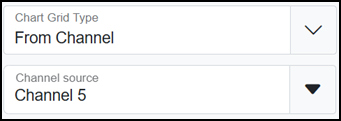
Channel source (only available if you select From Channel) - Select a dynamic data source, for example, an I/O channel or Maths channel from the available list or enter a numeric constant, see Linking a Channel as an Input for details.
Bar Chart
Bar chart compares discrete data points or visualizing categories in real-time:
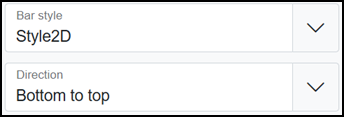
- Bar View Style - Select a style from the available list to display a bar chart:
- Style2D - Two-dimensional bar design.
- Style3D - Three-dimensional bar design.
- Direction - Select an orientation from the available list to display data:
- Top to bottom - Displays data from the top, moving downward. Useful for visualizing downward trends.
- Bottom to top - Displays data from the bottom, moving upward. Useful for visualizing upward trends.
- Left to right - Displays data from the left, moving right. Common for time-series data with time on the x-axis.
- Right to left - Displays data from the right, moving left. Useful for reversing data or emphasizing past data.
-
-
Once complete, select Review pending changes
 screen to review updates to the configuration, and submit them. See Reviewing and Submitting Changes for details if required.Note - Reviewing and submitting can be completed in bulk once you have completed all your additions and/or updates.
 - Select Close
 to close the Group Settings screen.
Last update - August 2026