Using the Historic View
The Historic view provides a linear chart of all .uhh files for a selected Group that have yet to be archived from a device.
To display the Historic view you can either:
-
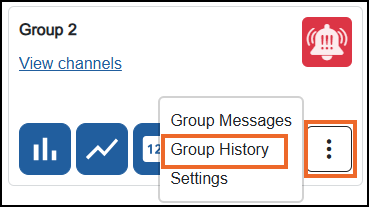
From the Groups screen, select Options
 - Group History on the Group required:
-
From the Live view of a Group, select Settings
 - Historic.
 -
From the Group Messages screen, select Options
- Group History on the message required.
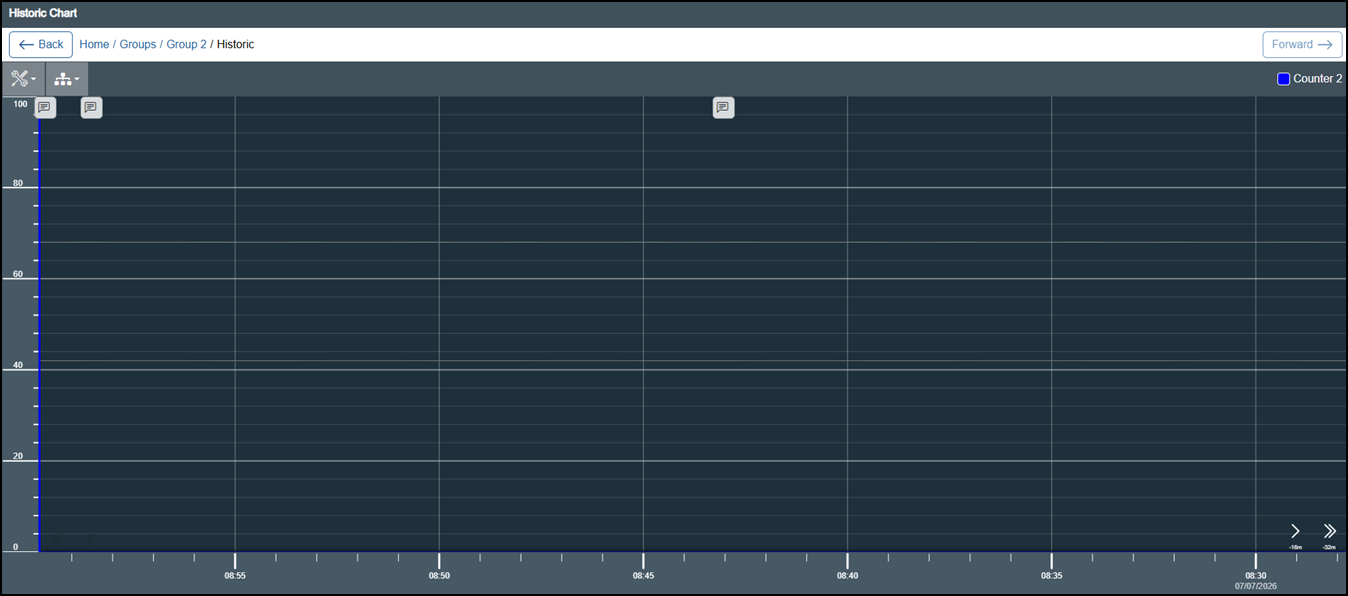
The Historic Chart screen displays:
Select anywhere on the chart to display the data for the point in time indicated:
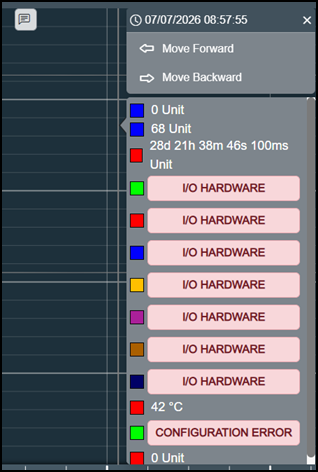
Select as required:
-
Move Forward - Moves forward through time one increment at a time as defined by the recording intervals.
-
Move Backward - Moves backward through time one increment at a time as defined by the recording intervals.
-
Channels - Displays current channel values.
-
Close
 to close the details.
The Historic Chart displays:
-
Timeline - A time scale, initially determined by the recording interval.
Tip - This updates automatically when you use Zoom in and Zoom out. -
System Alarms
 - Indications of System Alarms being triggered, select to display details.
 -
Notes
 - Notifications of activity on the Group, for example, the acknowledgement of an alarm, or a user logging in. The number in red indicates the number of messages within each Note. Select a Note to display the details, for example: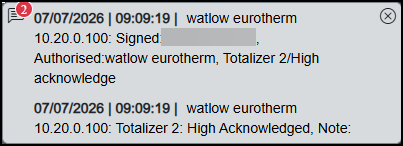

-
Periods of Lost Data - Highlights gaps or inconsistencies in the data collection, these are indicated by shaded areas or dashed lines.
-
Settings
- Select from:-
Return to Live view - Select to close the Historic Chart and open the live linear Group chart for this Group.
-
Zoom In - Select to increase the magnification of the display to show less data but in more detail.
Tip - You can also zoom in on a specific area manually, see Zooming in on a Specific Time Period for details. -
Zoom Out - Select to decrease magnification of the display to show more data but with less detail.
-
Reset - Select to clear any formatting and return to the default chart.
-
Go To - Select to define a time period to display. The Go To screen displays:
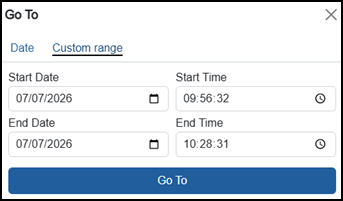
Select from the following and then select Go To
 :
:-
Custom range - Enter a start and finish date and time to display.
-
Date - Select a specific date to display.
-
-
Channels
 - Displays a list of the channels included in the selected Group:
-
Select an individual channel to display the historical trend for the selected channel.
Tip - Select Settings - Reset  to return to the default view.
-
-
-
Navigation arrows - Use the arrows to move through time as required:
-
Single arrows
 to move by small increments.
 -
Double arrows
 to move by double increments.Tip - The length of time for an increment is determined by the recording interval, see Configuring Groups Settings for details.
-
Zooming in on a Specific Time Period
You can also zoom in on a period of time from a screen:
-
From an EPM User Interface, touch the screen where you want to start, or finish the zoom and then drag to create a rectangle containing the data of interest
Or,
-
If you are logged in remotely or have a mouse plugged in to your device, click, hold and drag to create a rectangle containing the data of interest:
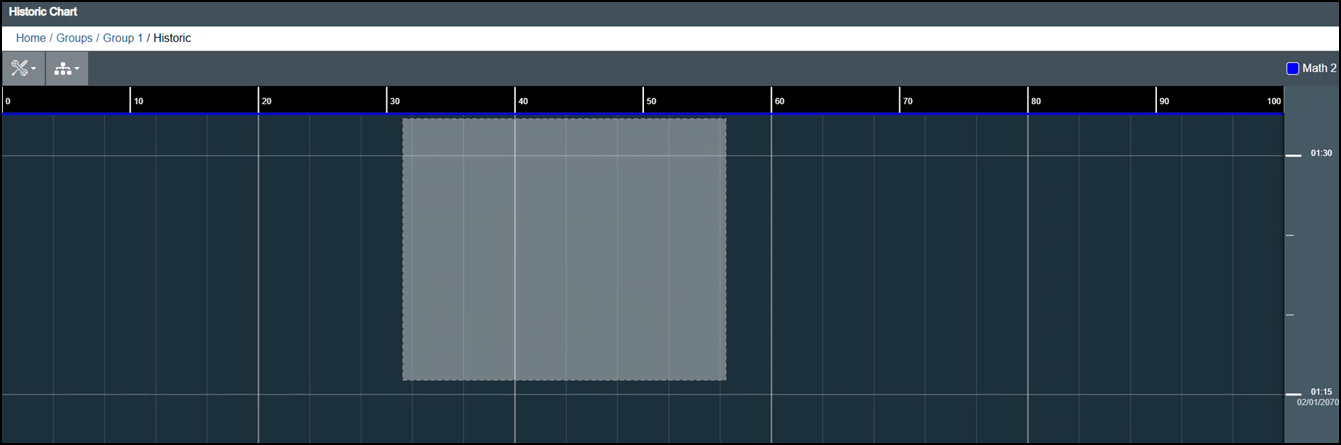
The Apply zoom? message displays:
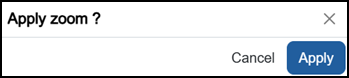
Select Apply
 to zoom in, or Cancel to leave with no change.Tip - Select Settings - Reset to return to the default view.
Last update - July 2026