Using the Live View
The Group live chart displays the data being monitored for a Group in real time.
To access a Group live chart, from the Group card required, select one of the following:
-
 Bar chart,
 -
 Linear chart, or
 -
 Numeric view.
The relevant charts display.
The current live view displays in the toolbar, select to change the view as required:
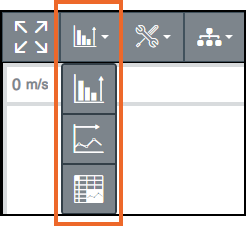
Select a format below to display details:
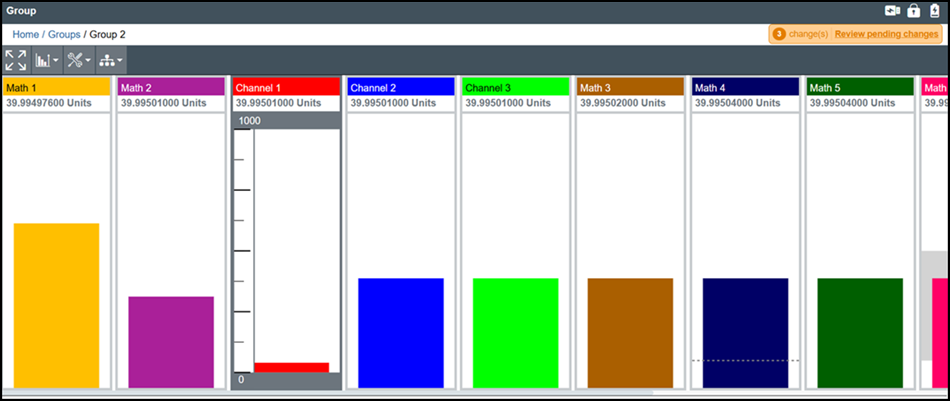
 Bar chart - Displays the live value and its units at the top of the column and dictate the height of the bar
When you open a Group bar chart, the first channel in the Group is highlighted automatically. Based on the Channel Cycle Time set in Group Settings, see Configuring Groups Settings for details, the channels highlight in turn:
-
Display - Depending on the configuration settings within the group selected, bar charts can display either:
-
Vertically - Top to bottom, or
-
Horizontally - Left to right or right to left.
See Configuring Groups Settings for details.
-
-
Channel selection - To highlight a specific channel:
-
Select Channels
 to move the focus to a specific channel, or
 -
Select the scale to move the highlight to the next channel in the Group. Repeat until the channel required is in focus.
Tip - Channel cycling resumes if you do not select any other channel or stop selecting the scale.
-
-
Scroll - If there are too many columns to display on one screen you can use the scroll bar, or on the device swipe, to move through the list, left and right, or up and down depending on your configuration settings.
-
Column title - By default the scale and the channel descriptor only display on the channel selected. Select Settings
 and tick Channel Descriptor to display the channel descriptor at the top of every column.
-
Alarms - If a channel has a triggered Alarm, the appropriate alarm symbol displays at the top of the channel column, select to open the Alarm Summary screen and view details. If this Group contains more channels than can display on your screen, and one of those not displaying has an active Alarm, the Alarm indicator displays with the number of active alarms displaying in a small circle:
Select to display the channel(s) with the active alarm.
-
Channel List - To display a list of the channels in the selected group, select Channels
. Select a channel to move the focus to it on the bar chart, the descriptor and scale on that channel automatically display.
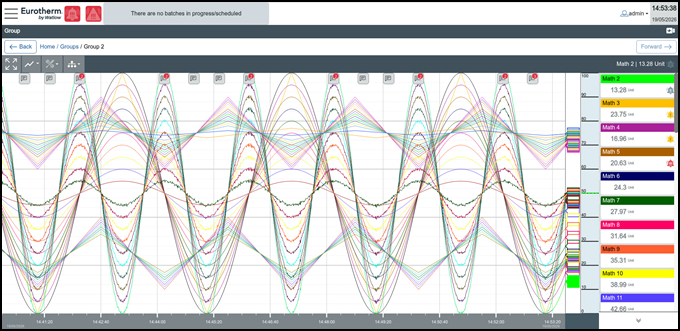
Linear chart - Displays the live value and its units as a series of data points connected by a trend line, where the latest data point represents the live value
When you open a Group linear chart, the first channel in the Group highlights automatically. Based on the Channel Cycle Time set in Group Settings, see Configuring Groups Settings for details, the channels highlight in turn, select a different channel to skip to it:
-
Display - Depending on the configuration settings within the group, linear charts can display as either:
-
Vertical - Top to bottom, or
-
Horizontal - Left to right or right to left.
-
-
Additional details display depending on the settings selected:
-
Top to Bottom View:
-
Triggered alarms - Appropriate alarm symbol, select to open the Alarm Summary screen and view details.
-
Note - Lists items monitored in your data, for example, Batch information and Audit entries, the first note text displays, preceded by the date and time it occurred and the Note icon displays the number of lines:

-
Power Ups, system clock changes and configuration changes - A broken line displays - - - - - - - - delineating the end of an old segment and the beginning of a new segment.
-
-
Left to Right/Right to Left View:
-
Triggered alarms - Appropriate alarm symbol, select to open the Alarm Summary screen and view details.
-
Note
 Lists items monitored in your data, for example, Batch information and Audit entries. The Note icon displays the number of lines.
 -
Power Ups, system clock changes and configuration changes - A broken line displays - - - - - - - - delineating the end of an old segment and the beginning of a new segment
-
-
-
Trend - Each channel in the group leaves a trend on the screen from the live value pointer
 .Tip - The pointer for the selected channel displays as solid, the pointer(s) for channels not selected display as outlines
-
Channel selection - To highlight a specific channel:
-
Select Channels
to move the focus to a specific channel, or -
Select the scale to move the highlight to the next channel in the Group. Repeat until the channel required is in focus.
Tip - Channel cycling resumes if you do not select any other channel or stop selecting the scale.
-
-
Channel Value - From a linear chart, to display the live value of a channel in the top right-hand corner of the Live view:
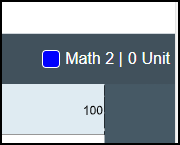
Select either:
-
The live value pointer
of the channel required, or -
From the toolbar, select Channels
and then select the channel required.
-
-
Numeric view - By default the real time value and the channel descriptor only display on the channel selected. To change this setting, select Settings
and tick Numeric view - To display real time numeric plates (also known as 'face plates') displaying the descriptors and real time values.
Numeric - Displays the live value and its units on real time numeric plates (also known as 'face plates')
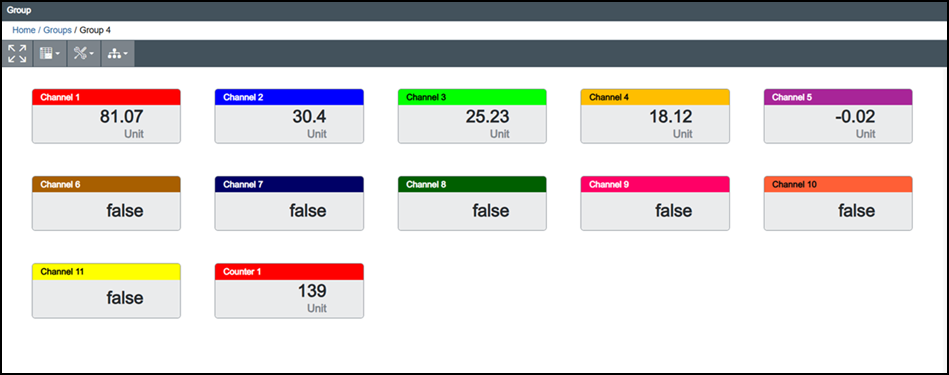
Within the Numeric view, the channels display in the order they were created by default. To change the order, select Channels to display the available list and then drag and drop the channels into the order required.
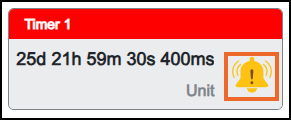
If a channel has a triggered alarm, the appropriate alarm symbol displays, select to open the Alarm Summary screen and view details:
The way the data displays, depends on the configuration settings within the Group selected.