Print a Chart / Spreadsheet
Print the chart at the current zoom and pan position. If required, you can also change the print output settings for that one print output (the print settings used are not saved).
- Go to Groups and Batches.
- Select the required Group, Custom (group) or Batch card.
- On the group card or batch card, click on
 .
.Note: Alternatively, click on the card itself to show the chart
- Select a Linear Chart or Circular chart or Spreadsheet.
- Select the data to be printed.
- Click on
 .
.
The Print page opens: - Give the print a title.
Note: If a title was set in group print settings it will show here. Change it if required.
- If required, change the current print settings:
 Print Settings
- Paper size: Select a paper size
- Printer: Select a printer. The printers listed in the drop-down box are set in Enable or Disable a Printer.
- Title: Specify the print settings a meaningful title.
- Include values: Tick this box to select a different sample interval for the table of values on the printouts using the Table of values sample interval drop down.
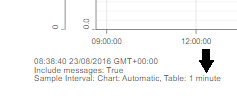
For example, if the chart is set to Automatic Sample Interval and you have selected 1 minute sample interval in the print settings, then the printout will display the Table of Values at a one minute sample interval and will be indicated as shown below:
Note: A notification message will appear if the system is unable to produce the data points at the requested sample interval. However, the Table of Values will still be displayed to show any messages but without the data.
Note: This can use considerable amounts of paper, depending on how many data points are available for the chart
- Include Chart: Includes the chart on the printout
- Include Messages: Includes messages on the printout.
- Show messages separately: Includes messages in a table under the chart (not overlaid on the chart (for linear charts)) or in a table below the chart (for circular charts). If Include messages and Show messages separately are ticked, the messages are included in the table of values at the appropriate time. This can use considerable amounts of paper, depending on how many data points are available for the chart.

- Show cursor statistics (Linear Chart only): Shows the statistics for the cursor
- Chart speed: The time axis for the chart
- Instrument Id: The ID of the relevant instrument
- Print deviation: (Auditor option only): Deviations from the original UHH data (Channel selection, Message selection and Sample data selection) are detailed in the chart printout.
- Sample interval: The time interval between samples
- Show milliseconds: Displays milliseconds
- Start / End Time: The Start and End time of the sampling
- Time of print: The time the print output was generated
- Select Time - Axis and Gridlines options (available only for linear chart and if Include chart option is ticked)
- Select either Fit to (Chart width) or Use fixed scaling. In each case the number and the units must be specified.
Fit to: the printout adjusts its time-axis scale according to the units specified. It will either fill the specified number of pages exactly or fit to a specified chart width. This selection is mutually exclusive with Use fixed scaling.
Use fixed scaling:the time-axis of the printout is set to a constant value, and the print occupies as many pages as is necessary. - Major divisions: set how many major grid lines are included on the chart (available if Include chart is ticked). The default value is 10.
- Minor divisions: set how many minor divisions are included on the chart (available if Include chart is ticked). The default value is 50.
- If required, click on Preview.
- Select from:
- Download PDF, or


Your chart will be printed on your selected printer or downloaded as a PDF to your default download folder.