Configure Linear Chart Prints
You can set default print settings for linear chart printouts. These settings are used for all linear chart printouts, unless Group or Individual Chart print settings are set.
Note: See the Important section at the end of this topic if you used Chart Width prior to Version 2.1.0.
Note: If required, you can add a print header, for example, a company logo, in the print output.
- Go to Settings > Default Settings.
- Go to Linear Chart Settings.
- Set the default manual print options as required for linear charts:
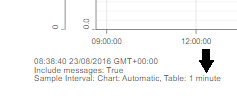
- Include values: Tick this box to select a different sample interval for the Table of Values (printout) using the Table of values sample interval drop down. For example, if the chart is set to Automatic Sample Interval and you have selected 1 minute sample interval in the print settings, then the printout will display the Table of Values at a one minute sample interval and will be indicated as shown below:
If Include messages and Show messages separately are ticked, the messages are included in the table of values at the appropriate time. This can use considerable amounts of paper, depending on how many data points are available for the chart. - Include chart: Includes the chart on the printout
- Include messages: Includes messages on the printout. If Show messages separately is ticked, the messages are included in a table under the chart (not overlaid on the chart (for linear charts)) or in a table below the chart (for circular charts).
- Show cursor statistics: Show the statistics for the cursor.
- Select Time - Axis and Gridlines options (available only for linear chart and if Include chart option is ticked)
- Select either Fit to (Chart width) or Use fixed scaling. In each case the number and the units must be specified.
Fit to: the printout adjusts its time-axis scale according to the units specified. It will either fill the specified number of pages exactly or fit to a specified chart width. This selection is mutually exclusive with Use fixed scaling.
Use fixed scaling:the time-axis of the printout is set to a constant value, and the print occupies as many pages as is necessary. - Major divisions: set how many major grid lines are included on the chart (available if Include chart is ticked). The default value is 10.
- Minor divisions: set how many minor divisions are included on the chart (available if Include chart is ticked). The default value is 50.
- Select either Fit to (Chart width) or Use fixed scaling. In each case the number and the units must be specified.
- Include values: Tick this box to select a different sample interval for the Table of Values (printout) using the Table of values sample interval drop down. For example, if the chart is set to Automatic Sample Interval and you have selected 1 minute sample interval in the print settings, then the printout will display the Table of Values at a one minute sample interval and will be indicated as shown below:
- Specify a Default Chart History View:
- Use custom rule: Set the time duration of the chart to show. Enter a duration and set the time value (not available on custom groups)
- Show entire group history: Displays the complete history of the chart.
- End of batch print chart sample interval.Specify a sample interval for the end of batch prints.
- Click on Save print/chart settings.
The default print settings are now set. These settings are used for all linear chart printouts, unless Group or Individual Chart print settings are set.
Note: You can specify the details to be included on the print output. See Add Print Details for more information.
IMPORTANT
As Chart Width has been replaced by Time Axis, if you were previously using the optional Chart Width feature, this setting will be lost upon moving over to V2.1.0.
In order to set it up again, you need to replicate the original info into the Fit to (Chart width) section. For example, if you had originally specified a chart width of 100mm, you now need to select Fit to (Chart width) and manually enter 100 into the first box and select "mm" from the drop-down. In this way the old chart width setting will be restored.