Using the Alarm Summary Screen
Alarms are indicators of process disturbances designed to notify operators of specified abnormal conditions. The Alarm Summary screen displays a real time view of current alarms. It allows you to display, filter and acknowledge active and unacknowledged alarms.
To display the Alarm Summary screen:
-
From the EPM User Interface screen, select Options
 - Alarms - Alarm Summary: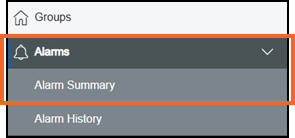
-
From the Status Bar, select one of the alarm indicators:
 Note - The Alarm Summary screen displays filtered by the alarm type selected.
 -
From a Group card, select the alarm indicator:
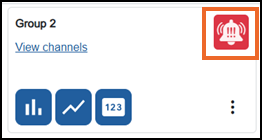
-
From a Live view, select the alarm symbol:
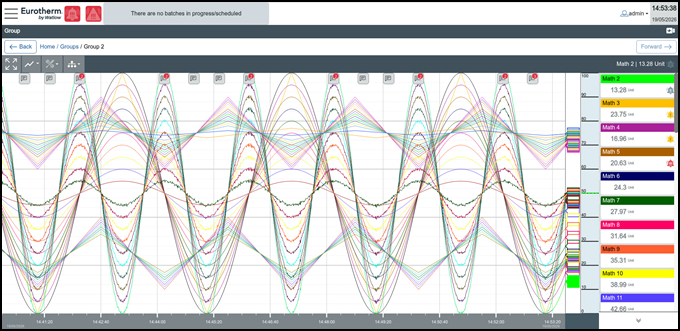
The Alarm Summary screen displays:
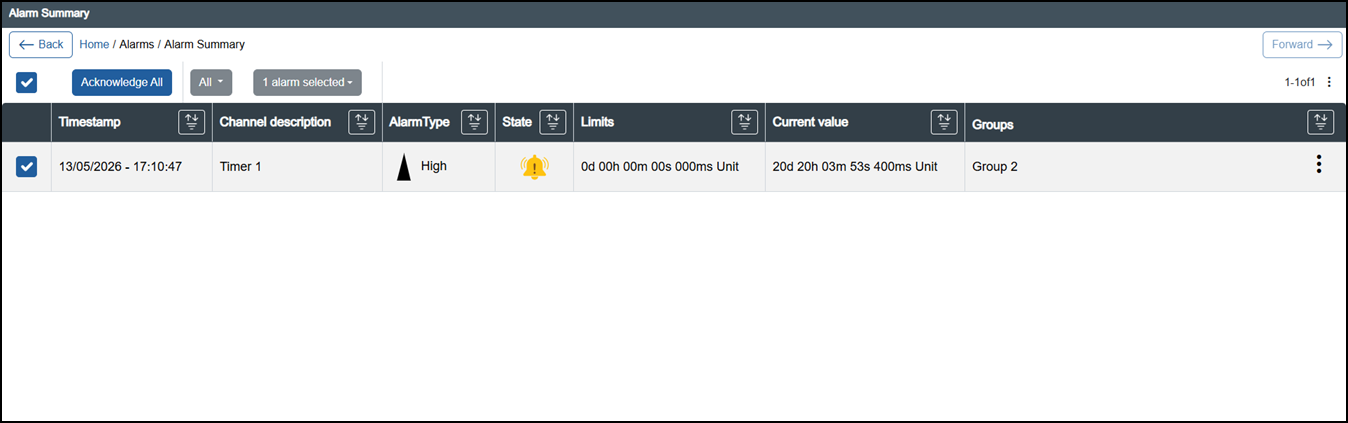
From the Alarm Summary screen, you can:
-
Acknowledge single or multiple alarms, see Acknowledging Alarms for details.
-
Filter the alarms that display, see Filtering the Alarm Summary Screen for details.
-
Sort by column, select Sort
 .
.
The Alarm Summary screen displays:
-
Timestamp, - The date and time the alarm triggered.
Tip - The date format is taken from the Internationalisation date and time setting within Settings, see Configuring Internationalization for details. -
Channel description - The name of the channel the alarm is attached to.
-
Alarm type - The type of alarm triggered, the relevant symbol and type.
-
State - The current state of the alarm:
-
Unacknowledged alarms display as flashing.
-
Acknowledged alarms display continuously.
See Understanding Alarm Symbols for details.
-
-
Limits - The limit value(s) set when the alarm was defined.
See Configuring an Alarm for details. -
Current value - The live value of the channel or group the alarm is attached to.
Note - To ensure full traceability of diagnostic conditions in alarm management, if the current value is outside of the range defined, either UNDER RANGE or OVER RANGE displays. -
Groups - The Group(s) the alarm is attached to where appropriate.
-
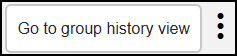
Go to group history view - Select the ellipsis at the end of an alarm row to display the Go to group history view option, select to open the Group history screen:
 See Using the Historic View for details.
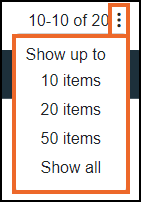
The Alarm Summary screen displays 10 items by default. Select Options  from the top right-hand corner, to change how many items to display per page:
Last update - June 2026