Circular Charts
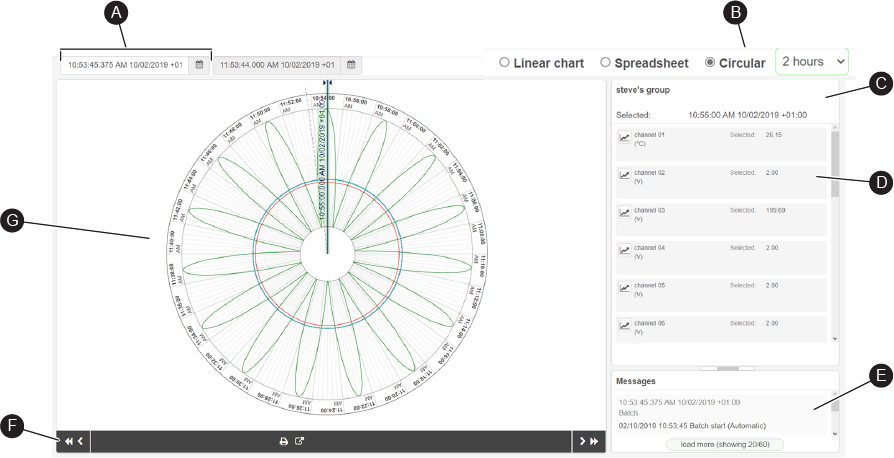
Set the start date and time range for the chart shown. The data range must be within the chart data range
Shows the current view (Circular) of the recorded data or specific batch. You can also switch to Linear or Spreadsheet view.
See configure the default chart view.
Note: When you select a circular chart or spreadsheet view you must select a date and time range.
Shows the group name (or the batch name) and the date and time at the point of the vertical cursor.

Shows all channels that can be displayed on the chart, which includes the channel name, channel color and units. By default, all channels are shown on the chart. Click on ![]() to show or hide channel / channels.
to show or hide channel / channels.
The Channel panel shows the current value for each channel based on the location of the chart on the vertical cursor.
The message panel shows annotations, alerts and messages that were added to the history file by the recorder before the file was uploaded. It also shows any annotations added after the import.
Note: If required, click, hold and drag the bar that separates the Channel and the Message panels to make the Message panel bigger (or smaller).

If required, filter the message list. Click on Message Filter and select which type of messages are required to be shown.
Up to the first 20 messages are available to view. If there are more messages (D), click on load more (showing 20/*******) to load more messages in the message panel, in batches of 20.
Click on a message to take you to the point in time on the chart.
- (A) Black: 'Other' messages
- (B) Red: Alarm messages
- (C) Blue: Annotations created in the visualization
| Icon | Description |
|---|---|

|
Move backward in time, as set in default chart view |

|
Takes to the print settings page. If required, customize the chart before printing |

|
Export the raw data as a CSV (Comma Separated Value) file for analysis |

|
Move forward in time as set in default chart view |
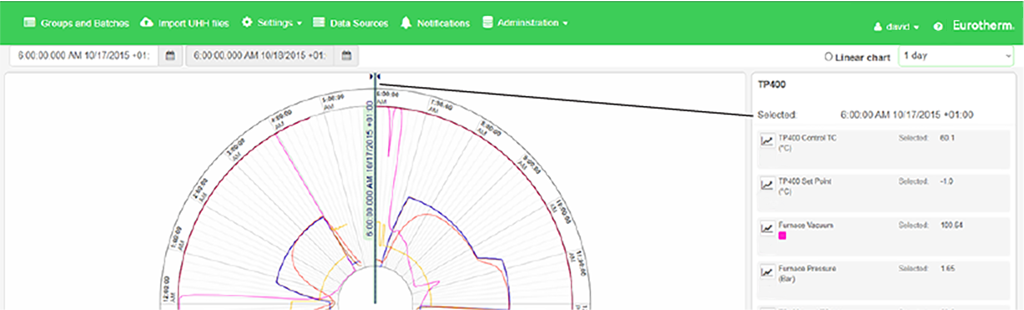
Shows the recorded data (or specific batch).
Click and hold on the vertical cursor and drag it left or right to turn the circular chart clockwise or anticlockwise. The left and right keyboard keys can also be used to rotate the chart (within the data limits). The date and time at the point of the vertical cursor is shown in the Selection Details panel.
Note: All dates and times are shown in instrument time.
Note: If you drag the cursor outside the visualization area the drag is lost.
Note: Point properties are not supported for Circular charts.