Linear Charts
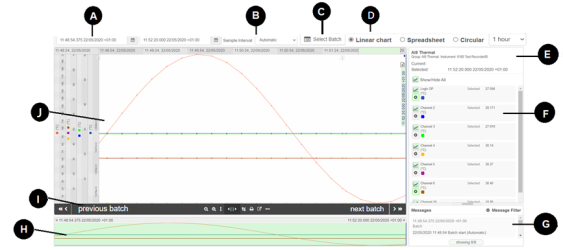
Set the start and end date and time range for the chart shown.
Note: If you select a date or time that exceeds the data range available in the database, the final data point's date and time is used instead.
The lines drawn on the chart are made up of individual data points connected by straight lines. Use the Sample Interval drop-down menu to see the same chart data at a different specified sample interval.

Allows you to easily locate a specific batch record from a linear chart or spreadsheet view.
- Click Select Batch.
The GoTo Batch dialog box appears and displays all the available batches for the specific group (same as Batch cards view). - Enter a meaningful text, and/or set the date and time to refine your search results.
Note: Search options will be read-only if you have opened the chart / spreadsheet from the batch cards. See setting the filter options on the batch cards.
- Click the Show/Hide details button to show additional batch information such as the file name, start / end time, predefined batch fields, started by, stopped by etc.
Note: Only available if there are any additional information to show for the specified batches.
- Select a batch from the list to instantly move the chart view to the beginning of the selected batch or to jump to the relevant row on the spreadsheet.
- Click Leave batch mode to exit the batch mode or Close to exit.
Shows the current view (Linear) of the recorded data or specific batch. You can also switch to Spreadsheet or Circular chart view.
See configure the default chart view.
Note: When you select a circular chart or spreadsheet view you must select a date and time range.
Shows the chart date and time data of the cursor position and the single or dual vertical cursors.

This data comprises:
- The group name (or the batch name) at the top (A)
- The Current field (B): Always shows. As the cursor is moved around the chart, the date and time under the cursor is shown
- A Selected field (not shown) shows when a vertical cursor is used. The time and date for that vertical cursor are shown
- A set of Range fields (C) are shown when Range Mode is selected and two vertical cursors are set (a range area), the Range from, Range to and Range duration data is shown
Displays all channels that can be displayed on the chart, which includes the channel name, channel color and units. By default, all channels are shown on the chart. Click on ![]() to show or hide channel / channels.
to show or hide channel / channels.
To hide a Scale for an individual channel select ![]() to show or hide All scales.
to show or hide All scales.
Note: In case of 50 or more channels the Show/Hide All scales will not remain selected by default. For 49 or less channels the Show/Hide All scales option will remain automatically selected.
The Channel panel shows the current value for each channel based on the location of the vertical cursor on the chart, a marked point on the chart, or a selected range on the chart.

The message panel shows annotations, alerts and messages that were added to the history file by the recorder before the file was uploaded. It also shows any annotations added after the import.
Note: If required, click, hold and drag the bar that separates the Channel and the Message panels to make the Message panel bigger (or smaller).

If required, filter the message list. Click on Message Filter and select which type of messages are required to be shown.
Up to the first 20 messages are available to view. If there are more messages (D), click on load more (showing 20/*******) to load more messages in the message panel, in batches of 20.
Click on a message to take you to the point in time on the chart.
- (A) Black: 'Other' messages
- (B) Red: Alarm messages
- (C) Blue: Annotations created in the visualization
The Navigator panel gives an overview of the whole data-set, irrespective of any zoom or pan.
If the chart visualization is zoomed in, with the chart control buttons, the Navigator panel can be used to pan which section of the data-set (A) is shown in the main chart panel in both the x- and y-axis.
Click on and drag handles (B), at either end of the Navigator, to zoom into a specific area of interest on the chart. 
Click and hold, in the Navigator panel, to move the chart left and right (C).
At the top of the Navigator panel there are time and date labels (D), which show the date and time range of the whole data-set. These are fixed and do not change when you zoom or pan the chart (unless the Zoom to Navigator range button is pressed).
| Icon | Description |
|---|---|

|
Moves backward in time as set in default chart view |
| previous batch | Only for batches. Jumps to the previous batch. This will be invisible if there is no previous batch. |
| next batch | Only for batches. Jumps to the next batch. This will be invisible if there are no further batches. |

|
Zooms out on the x-axis to see a longer time period in the main chart panel Note: You can also use the mouse wheel to zoom out |

|
Zooms in on the x-axis to see a shorter time period, but with more detail, in the main chart panel.
Note: You can also use the mouse wheel to zoom in. |

|
Maximizes the scale zoom range. Maximizes the scale range (height) so maximum chart content shown. Useful after using the Select region tool. |

|
Range Mode: With a vertical cursor added, click to add a second vertical cursor on to the chart to set a range of date and time for analysis from the first vertical cursor. The information shown in Channel details shows range specific information for each channel. Click on and drag a vertical cursor to extend or reduce the range area Click on a vertical cursor to highlight it, then click in the chart area to move that vertical cursor (to extend or reduce the range area) |
Draws an area, with the cursor, to zoom in to. Click on the +icon in the drawn area to zoom in.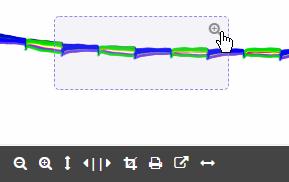 |
|

|
Takes you to the print settings page. If required, customize the chart before printing. |

|
Exports the raw data as a CSV (Comma Separated Value) file for analysis |

|
Zooms to Navigator range: Set the Navigator zoom the visible content of the main chart. |
Available if more data is available to see on-screen (or click on More Data Available). |
|

|
Moves forward in time as set in default chart view |
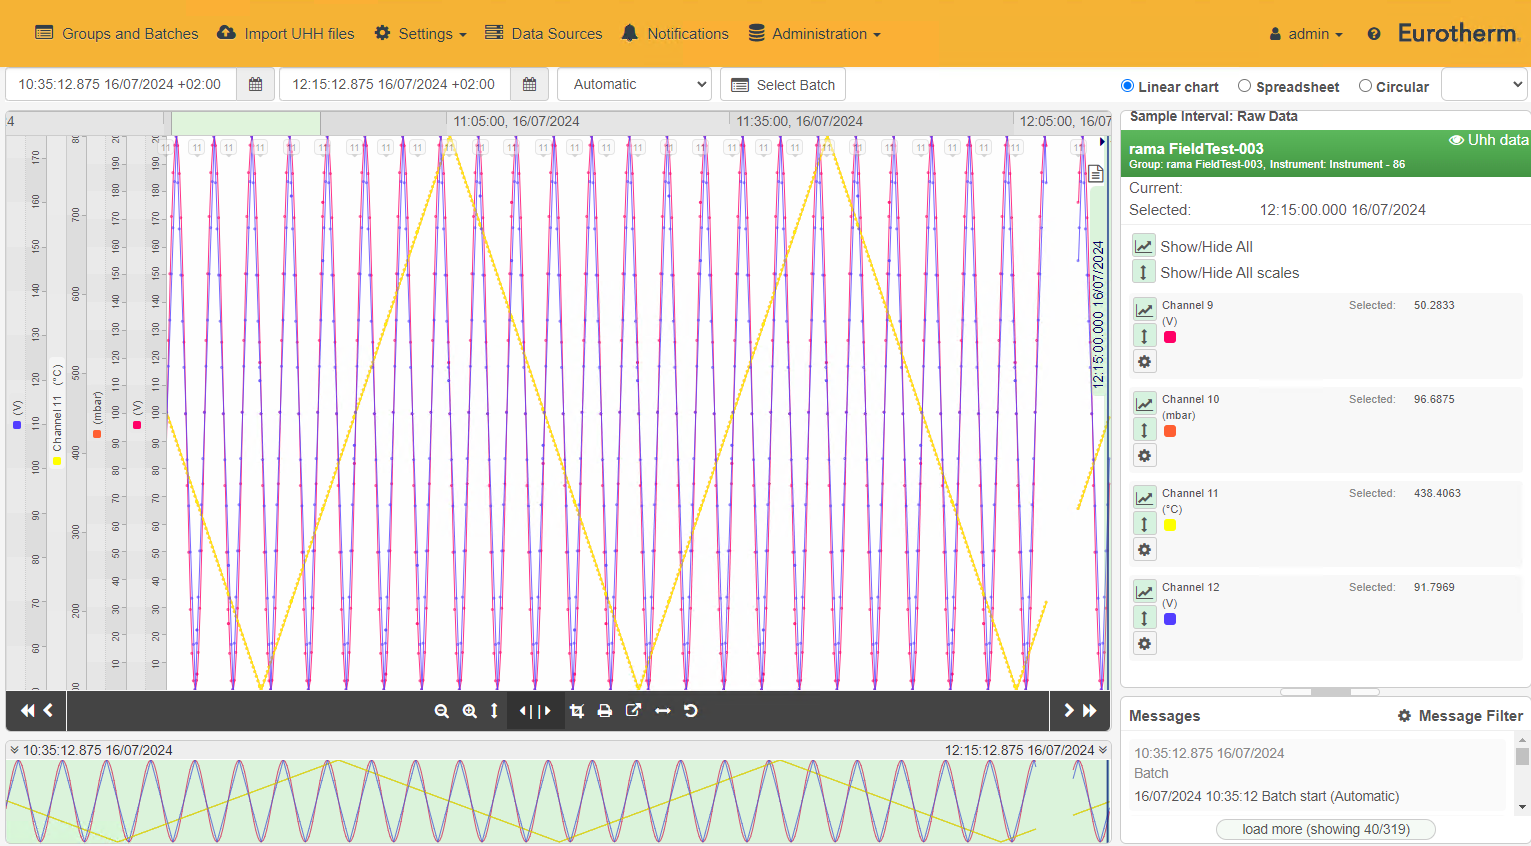
Shows the recorded data (or specific batch). The zoom in, zoom out and pan controls let you examine the data in fine detail.
Note: All dates and times are shown in instrument time.

Time labels are shown at the top of the main chart, which show the time of when the shown chart data begins. As you zoom in and out, or pan the chart left and right, the time labels change accordingly.
A moving and dynamic time label (E) also shows above the main chart panel when the cursor (F) is moved within the chart itself:

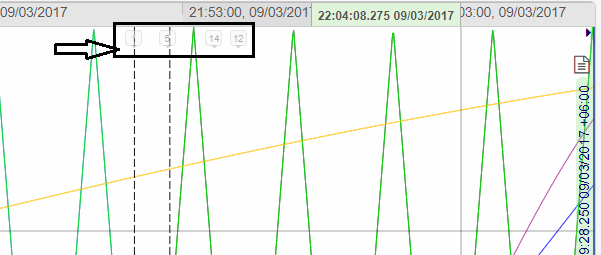
Where there are messages (and annotations) on the chart they are shown by small indicators with a message count. Click on a message indicator to see the recorded messages.

- A red indicator contains at least one alarm message
- A blue indicator contains at least one annotation (created in the visualization), but no alarm messages
- A black indicator contains messages only
Click on the chart to add a vertical cursor, the specific time and values of where the vertical cursor is on the chart are shown in Selection Details. Dual vertical cursors can be set, to see a time range.
The user can select (independently) what channel scales are viewed on the chart and what channel scales are visible (same for print preview and print)
The channel scales are grouped by minimum, maximum and units:
- Channels with the same scale (same minimum, maximum and units, for example 0 - 100 mbar and 0 - 100 °C), will share the same scale
If three channels share the same scale (0 - 1000 °C), they will show on the same scale - Channels that do not share the same scale will have independent scales
When the configuration of a channel changes, resulting in the creation of a new UHH file, the point at which this occurs is indicated by a vertical dotted line. Moving the cursor over this line changes the information displayed for the relevant channel in the 'Channels' area.