Configuring Chart and Presentation Settings
The Chart and presentation settings screen allows you to configure how data such as units, scale and zone settings, color, and other visual elements including the appearance of charts display:
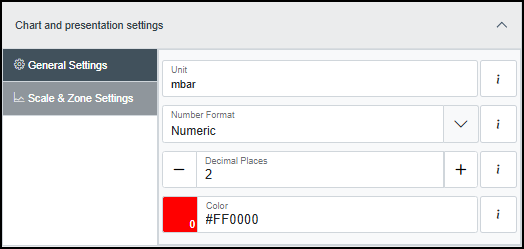
-
Analog Input channels, see Configuring an Analog Input Channel for details.
-
Digital Input channels, see Configuring a Digital Input Channel for details.
-
Digital Output channels, see Configuring a Digital or Relay Output Channel for details.
-
Applications, see Configuring the Chart and Presentation Settings of an Application Channel for details.
-
Maths, see Configuring the Chart and Presentation Settings of a Maths Channel for details.
-
Counters, see Configuring a Counter Channel for details.
-
Timers, see Configuring a Repeated Pulse Timer Channel for details.
-
Totalizers, see Configuring a Totalizer Channel for details.